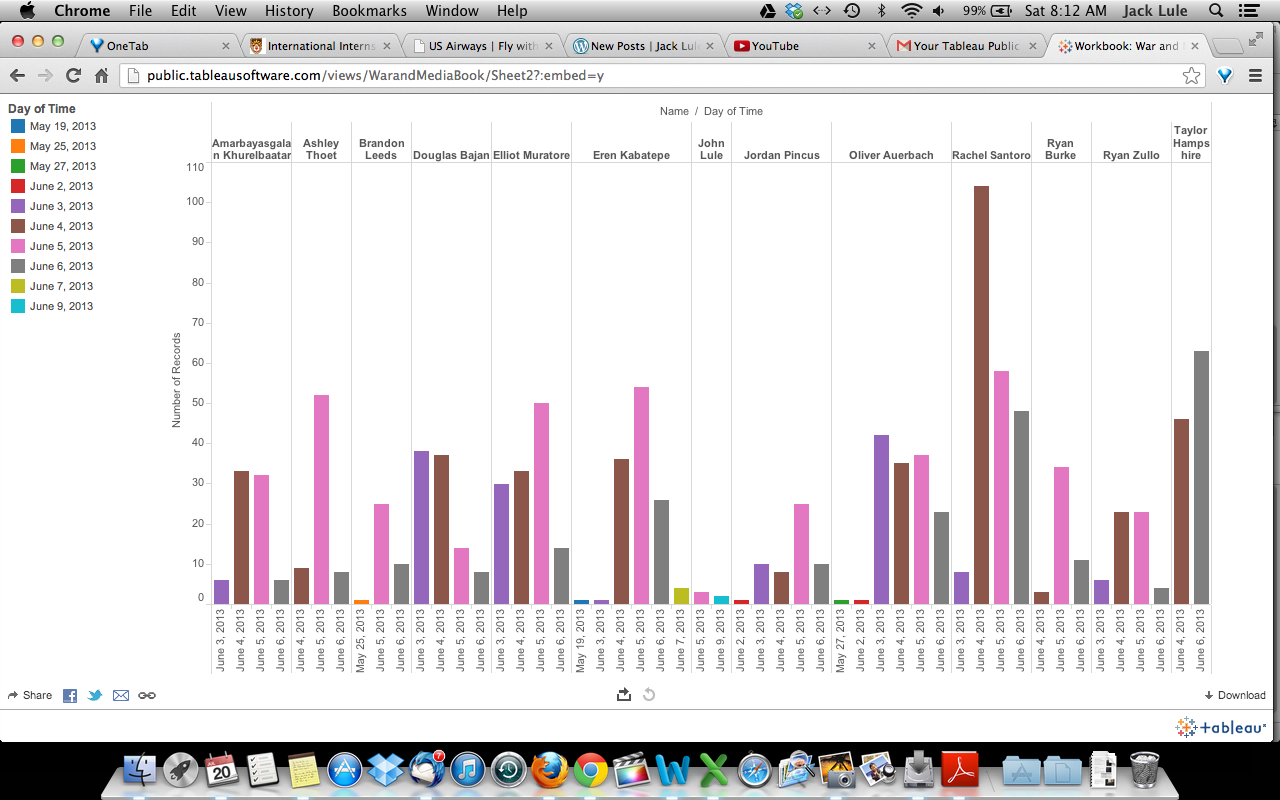
For my online classes, I encourage a great deal of participation through the online discussion board. Our university uses Moodle (Coursesite) and the boards are called Forums. I like to keep track of all student interactions. There are a lot of them. I was looking for a visual representation so I could see at a glance who was performing well and who was not. I found Tableau to be excellent.
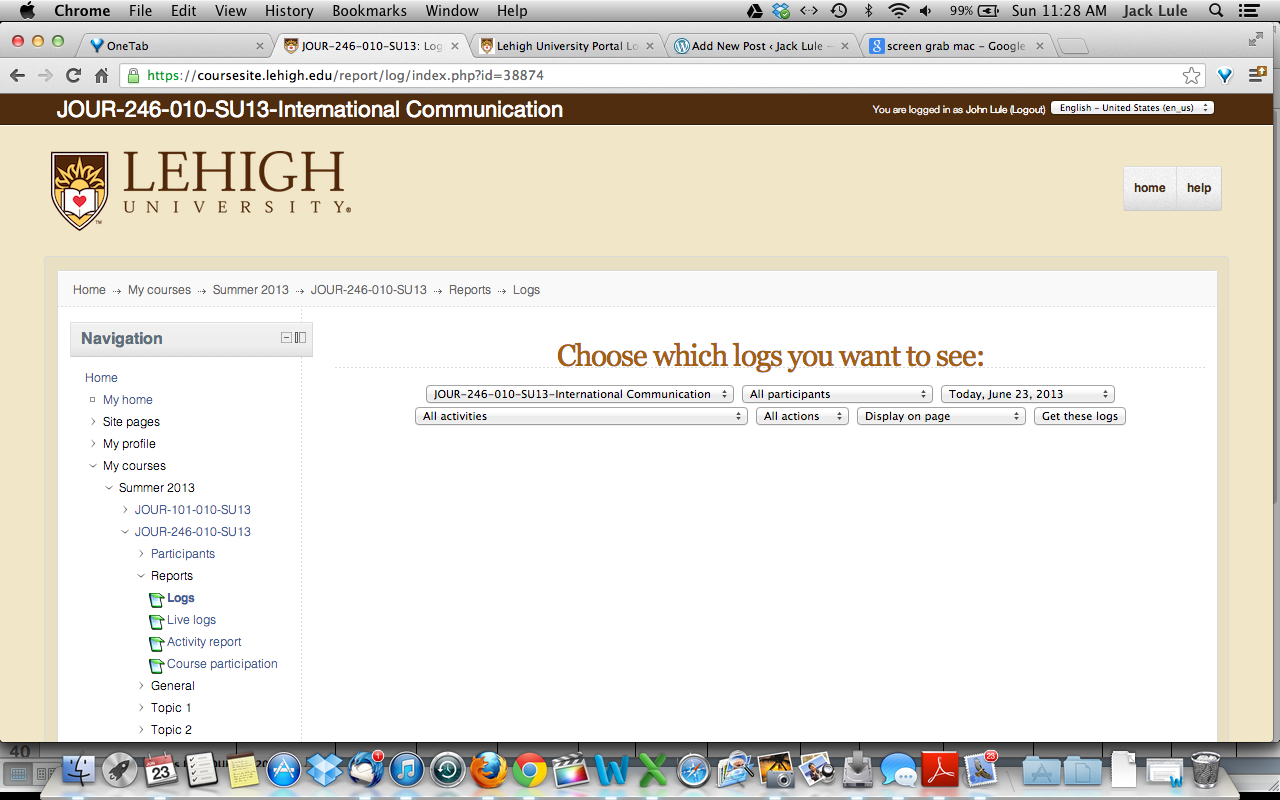
Here is what I did: In Coursesite — Course>Reports>Logs
I have some choices here. I cannot do all Forums and don’t want all activities. I do Forum by Forum:
All Days>[Select Forum]>All Actions>Download in Excel>Get These Logs>Open w Excel>Save to Desktop
I fix the data so it can be read by Tableau: Put appropriate titles in First Row — Date, Name, Action (delete other unnecessary columns).
Open Tableau desktop. Open the Excel file in Tableau. Put Name in Column and then Day; in Row put Number of Records; on Show me, click on Bar Chart. I got a fine, fast visual representation of the Forum participation of each student.
Ah, yes. You must do this on a PC. Tableau is not yet made for Mac.
